


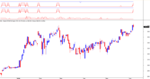
This formula is for reading price trend and volume :
- Red lines indicate break highs, Blue lines indicate break lows
- 1st row : indicates break 3M (3months), 6M & 9M respectively
- 2nd row : indicates break 1Y (1year), 2Y & 3Y respectively
- 3rd row : indicates volume spike of 2x, 3x, 4x & 5x respectively, above 6month of average volume.
- 1st row : indicates break 3M (3months), 6M & 9M respectively
- 2nd row : indicates break 1Y (1year), 2Y & 3Y respectively
- 3rd row : indicates volume spike of 2x, 3x, 4x & 5x respectively, above 6month of average volume.
For stock breaking highs : showing strong bullish trend and might have a good chance to go Long, vice versa on break lows
For stock with lots of volume spike, reading might indicates accumulation & distribution
Indicator to be set on own panel
Disclaimer On : Use on own discretion
1
2
3
4
5
6
7
8
9
10
11
12
13
14
15
16
17
18
19
20
21
22
23
24
25
26
27
28
29
30
31
32
33
34
35
36
37
38
39
40
41
42
43
44
45
46
47
48
49
50
51
52
53
54
| _SECTION_BEGIN("Month/Year/Vol low/high");SetChartOptions( 1, Flags = 0, 0); _N(Title = "");High9M = IIf(H>Ref(HHV(H, 9*20) , -1) AND (Ref(C,-9*20) != 0),13,10);High6M = IIf(H>Ref(HHV(H, 125) , -1) AND (Ref(C,-125) != 0),12,10);High3M = IIf(H>Ref(HHV(H, 3*20) , -1) AND (Ref(C,-3*20) != 0),11,10);Low9M = IIf(L<Ref(LLV(L, 9*20) , -1) AND (Ref(C,-9*20) != 0),11,14);Low6M = IIf(L<Ref(LLV(L, 125) , -1) AND (Ref(C,-125) != 0),12,14);Low3M = IIf(L<Ref(LLV(L, 3*20) , -1) AND (Ref(C,-3*20) != 0),13,14);Plot(High9M, "3/6/9 Month High",ParamColor("high9 Color",colorRed), ParamStyle("high9 Style", styleLine)|styleNoTitle|styleNoLabel);Plot(High6M, "6",ParamColor("high6 Color",colorRed), ParamStyle("high6 Style", styleLine)|styleNoTitle|styleNoLabel);Plot(high3M, "3",ParamColor("high3 Color",colorRed), ParamStyle("high3 Style", styleLine)|styleNoTitle|styleNoLabel);Plot(Low9M, "3/6/9 Month Low",ParamColor("low9 Color",colorBlue), ParamStyle("low9 Style", styleLine|styleNoTitle|styleNoLabel));Plot(Low6M, "6",ParamColor("low6 Color",colorBlue), ParamStyle("low6 Style", styleLine)|styleNoTitle|styleNoLabel);Plot(Low3M, "3",ParamColor("low3 Color",colorBlue), ParamStyle("low3 Style", styleLine)|styleNoTitle|styleNoLabel); p = 250;High1Y = IIf(H > Ref(HHV(H, 1*p), -1) AND Ref(C,-1*p) != 0, 6, 5);high2Y = IIf(H > Ref(HHV(H, 2*p), -1) AND Ref(C,-1*p) != 0, 7, 5);High3Y = IIf(H > Ref(HHV(H, 3*p), -1) AND Ref(C,-1*p) != 0, 8, 5);Low1Y = IIf(L < Ref(LLV(L, 1*p), -1) AND Ref(C,-1*p) != 0, 8, 9);low2Y = IIf(L < Ref(LLV(L, 2*p), -1) AND Ref(C,-1*p) != 0, 7, 9);Low3Y = IIf(L < Ref(LLV(L, 3*p), -1) AND Ref(C,-1*p) != 0, 6, 9);Plot(high1Y, "1/2/3 Year High 1",ParamColor("high1 Color",colorRed), ParamStyle("high1 Style", styleLine)|styleNoTitle|styleNoLabel);Plot(high2Y, "2",ParamColor("high2 Color",colorRed), ParamStyle("high2 Style", styleLine)|styleNoTitle|styleNoLabel);Plot(high3Y, "3",ParamColor("high3 Color",colorRed), ParamStyle("high3 Style", styleLine)|styleNoTitle|styleNoLabel);Plot(Low1Y, "1/2/3 Year Low 1",ParamColor("low1 Color",colorBlue), ParamStyle("low1 Style", styleLine)|styleNoTitle|styleNoLabel);Plot(Low2Y, "2",ParamColor("low2 Color",colorBlue), ParamStyle("low2 Style", styleLine)|styleNoTitle|styleNoLabel);Plot(Low3Y, "3",ParamColor("low3 Color",colorBlue), ParamStyle("low3 Style", styleLine)|styleNoTitle|styleNoLabel);p = 125;value5 = IIf(V>=5*MA(V, p),4,0);value4 = IIf(V>=4*MA(V, p),3.2,0);value3 = IIf(V>=3*MA(V, p),2.4,0);value2 = IIf(V>=2*MA(V, p),1.6,0);value1 = IIf(V>=1*MA(V, p),0.8,0); Plot(value5, "Acc Volume 5x",ParamColor("value5 Color",colorRed), ParamStyle("value5 Style", styleLine|styleNoTitle|styleNoLabel));Plot(value4, "4x",ParamColor("value4 Color",colorRed), ParamStyle("value4 Style", styleLine|styleNoTitle|styleNoLabel));Plot(value3, "3x",ParamColor("value3 Color",colorRed), ParamStyle("value3 Style", styleLine|styleNoTitle|styleNoLabel));Plot(value2, "2x",ParamColor("value2 Color",colorRed), ParamStyle("value2 Style", styleLine|styleNoTitle|styleNoLabel));Plot(value1, "1x",ParamColor("value1 Color",colorRed), ParamStyle("value1 Style", styleLine|styleNoTitle|styleNoLabel));_SECTION_END(); |
0 Nhận xét :
Đăng nhận xét